1-Year Retention Rates
First-Time Associate Seeking Freshmen
| Cohort | Retained (n) | Retained (%) | |
|---|---|---|---|
| Fall 2015 | 2966 | 1769 | 59.6% |
| Fall 2016 | 3227 | 1990 | 61.7% |
| Fall 2017 | 3399* | 2003* | 58.9% |
| Fall 2018 | 3182* | 1869* | 58.7% |
| Fall 2019 | 3291 | 1875 | 57.0% |
| Fall 2020 | 2729 | 1575 | 57.7% |
| Fall 2021 | 2872 | 1646 | 57.3% |
| Fall 2022 | 3008 | 1734 | 57.6% |
| Fall 2023 | 2999 | 1821 | 60.7% |
| Fall 2024 | 3086 | 1981 | 64.2% |
| Fall 2025 Goal | 61.9% |

Goals are set at one percentage point above the 3-year average. *In December 2020, new procedures were established to define FTF and FTFTF cohorts. The Fall 2017 and Fall 2018 cohort numbers have been updated to reflect this change. This update does not affect the accuracy of previously published data. FTF = First-Time Freshmen. First-Time Freshmen are students with the student type of A, U, W, or Y in Fall plus students with student type A, U, W, or Y in the immediately preceding Summer who are also enrolled in the Fall. Retention numbers are updated each November, after IR's Fall census.
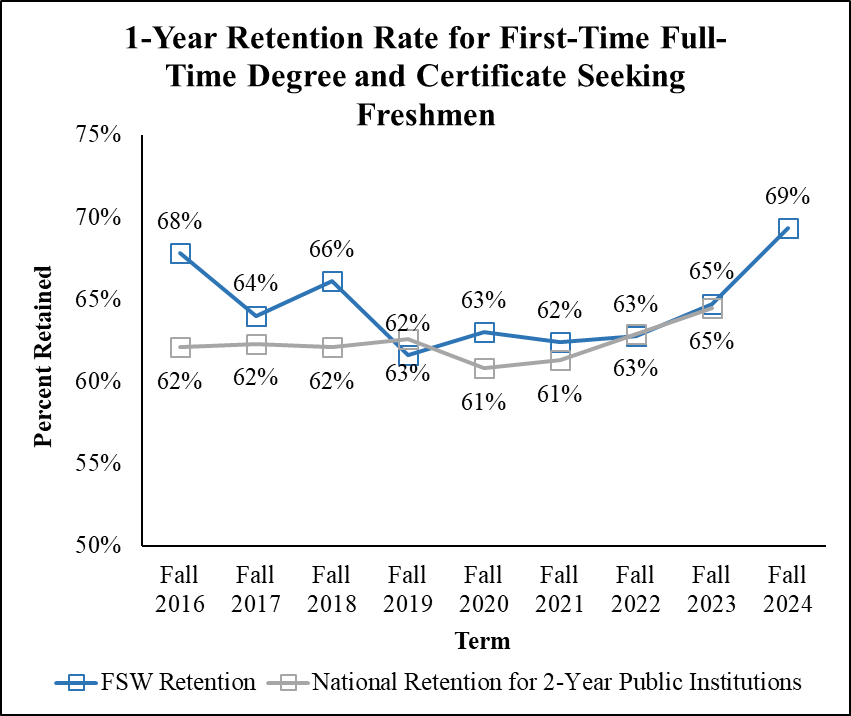
First-Time Full-Time Degree and Certificate Seekers

| Cohort | Retained (n) | Retained (%) | |
|---|---|---|---|
| Fall 2016 | 2094 | 1420 | 67.8% |
| Fall 2017 | 1983* | 1269* | 64.0% |
| Fall 2018 | 1984* | 1312* | 66.1% |
| Fall 2019 | 2083 | 1284 | 61.6% |
| Fall 2020 | 1861 | 1173 | 63.0% |
| Fall 2021 | 1816 | 1134 | 62.4% |
| Fall 2022 | 1906 | 1196 | 62.7% |
| Fall 2023 | 1846 | 1195 | 64.7% |
| Fall 2024 | 1852 | 1284 | 69.3% |
| Fall 2025 Goal | 66.6% |
Goals are set at one percentage point above the 3-year average. FTFTF = First-Time, Full-Time Freshmen. FTFTF are students who are First-Time Freshmen and have full-time status in the Fall semester in which they were captured. National retention data comes from IPEDS data via the National Center for Education Statistics (NCES). To explore national trends in retention or other education related statistics, please visit the NCES webpage. Please note that no national retention data for Fall 2024 is available at this time. Retention numbers are updated each November, after IR's Fall census.
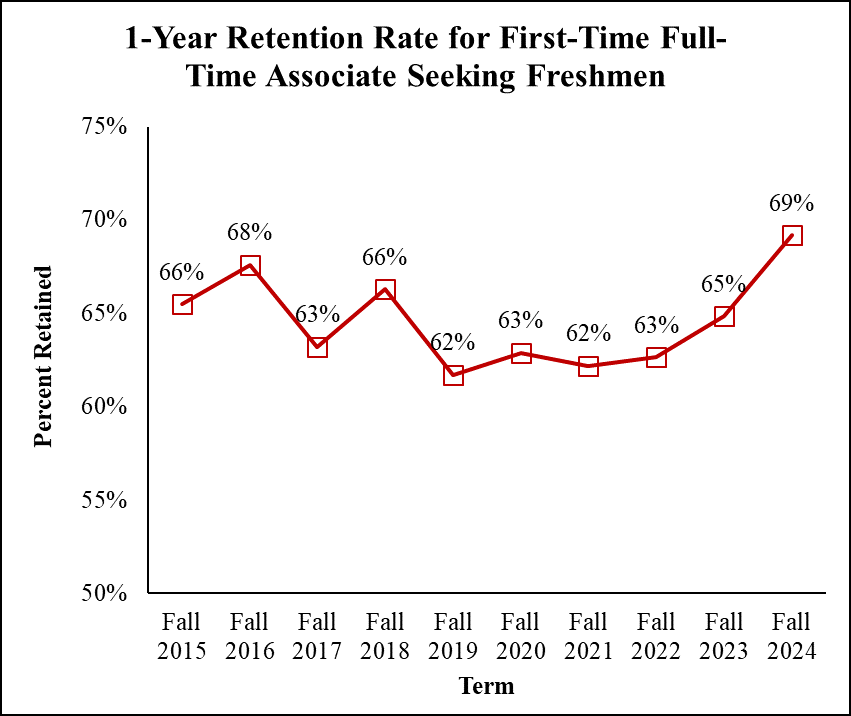
First-Time Full-Time Associate Seeking Freshmen
| Cohort | Retained (n) | Retained (%) | |
|---|---|---|---|
| Fall 2015 | 1870 | 1224 | 65.5% |
| Fall 2016 | 2079 | 1406 | 67.6% |
| Fall 2017 | 2081* | 1315* | 63.2% |
| Fall 2018 | 1977* | 1311* | 66.3% |
| Fall 2019 | 2074 | 1279 | 61.7% |
| Fall 2020 | 1850 | 1163 | 62.9% |
| Fall 2021 | 1797 | 1118 | 62.2% |
| Fall 2022 | 1887 | 1182 | 62.6% |
| Fall 2023 | 1832 | 1188 | 64.8% |
| Fall 2024 | 1836 | 1270 | 69.2% |
| Fall 2025 Goal | 66.6% |

Goals are set at one percentage point above the 3-year average. FTFTF = First-Time, Full-Time Freshmen. FTFTF are students who are First-Time Freshmen and have full-time status in the Fall semester in which they were captured. Retention numbers are updated each November, after IR's Fall census.
2-Year Retention Rates
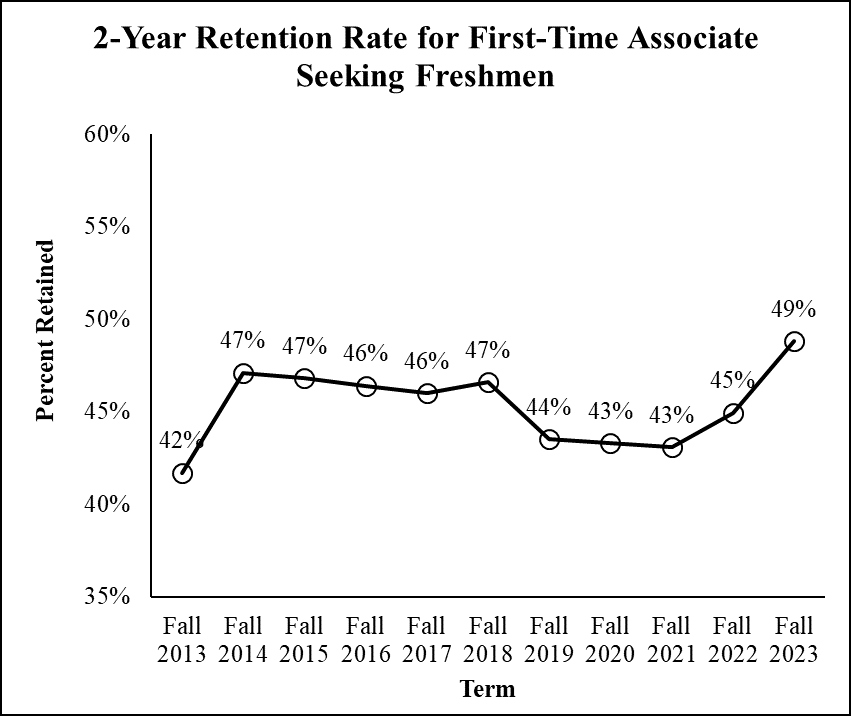
First-Time Associate Seeking Freshmen

| Cohort | Retained (n) | Retained (%) | |
|---|---|---|---|
| Fall 2013 | 2942 | 1226 | 41.7% |
| Fall 2014 | 2975 | 1400 | 47.1% |
| Fall 2015 | 2966 | 1389 | 46.8% |
| Fall 2016 | 3227 | 1498 | 46.4% |
| Fall 2017 | 3399 | 1565 | 46.0% |
| Fall 2018 | 3182 | 1483 | 46.6% |
| Fall 2019 | 3291 | 1431 | 43.5% |
| Fall 2020 | 2729 | 1181 | 43.3% |
| Fall 2021 | 2872 | 1237 | 43.1% |
| Fall 2022 | 3008 | 1352 | 44.9% |
| Fall 2023 | 2999 | 1464 | 48.8% |
| Fall 2024 Goal | 46.6% |
Goals are set at one percentage point above the 3-year average. FTF = First-Time Freshmen. First-Time Freshmen are students with the student type of A, U, W, or Y in Fall plus students with student type A, U, W, or Y in the immediately preceding Summer who are also enrolled in the Fall. Retention numbers are updated each November, after IR's Fall census.
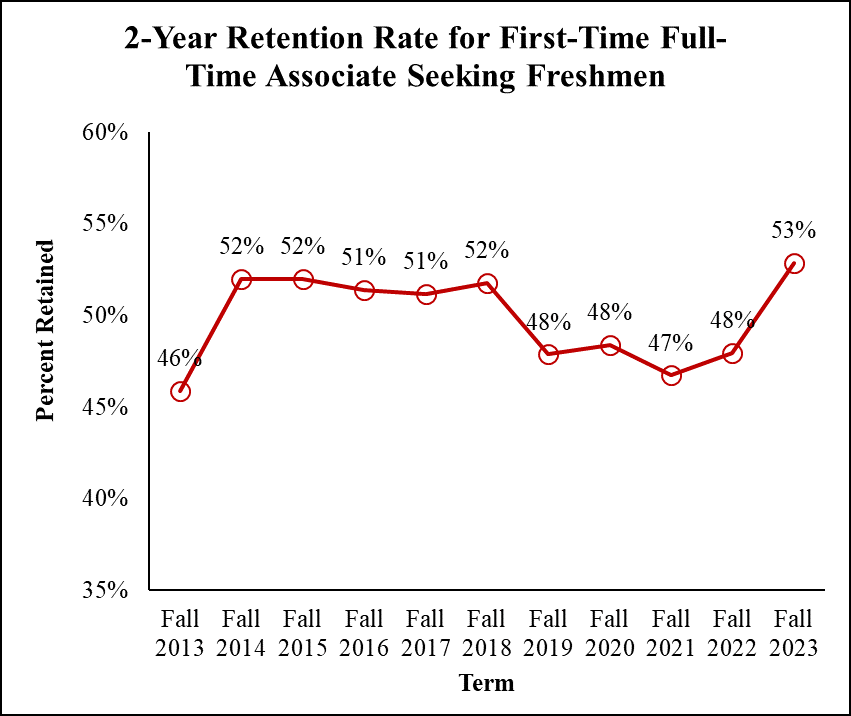
First-Time Full-Time Associate Seeking Freshmen
| Cohort | Retained (n) | Retained (%) | |
|---|---|---|---|
| Fall 2013 | 1810 | 830 | 45.9% |
| Fall 2014 | 1880 | 977 | 52.0% |
| Fall 2015 | 1870 | 972 | 52.0% |
| Fall 2016 | 2079 | 1068 | 51.4% |
| Fall 2017 | 2081 | 1066 | 51.2% |
| Fall 2018 | 1977 | 1025 | 51.8% |
| Fall 2019 | 2074 | 993 | 47.9% |
| Fall 2020 | 1850 | 896 | 48.4% |
| Fall 2021 | 1797 | 840 | 46.7% |
| Fall 2022 | 1887 | 905 | 48.0% |
| Fall 2023 | 1832 | 969 | 52.9% |
| Fall 2024 Goal | 50.2% |

Goals are set at one percentage point above the 3-year average. FTFTF = First-Time, Full-Time Freshmen. FTFTF are students who are First-Time Freshmen and have full-time status in the Fall semester in which they were captured. Retention numbers are updated each November, after IR's Fall census.